Crypto Price Predictions Using Candlestick Patterns
Crypto Price Predictions Using Candlestick Patterns
Technical analysis is one of the best methods you can use to predict prices in financial markets. It's a method that doesn't just consider a company's basic value or recent news but instead focuses on studying the past and present movements of the market. By interpreting this data, traders can make predictions about future price movements. According to research of Park & Irwin: “Modern studies indicate that technical trading strategies consistently generate economic profits in a variety of speculative markets”
So, what exactly does technical analysis entail?
Indicators: These are mathematical calculations based on the price, volume, or open interest of a security. Popular examples include the Moving Average (MA), which smoothens price data to create a single flowing line, and the Relative Strength Index (RSI), which identifies overbought or oversold conditions in a traded security.
Support and Resistance Levels: These are horizontal lines drawn on a chart to indicate where price has historically had a hard time moving above (resistance) or below (support). If a cryptocurrency is approaching a support level and doesn't fall below it, this might indicate strong buying interest at that price.
Why are these tools so crucial? Because they give traders a way to take the vast amount of information in the market and distill it down into actionable insights. Whether deciding when to buy, when to sell, or when to sit tight, these tools offer guidance grounded in data and historical precedent.
John J. Murphy, a foremost expert in the field, said, "The assumption that price discounts everything basically means the market price is a reflection of all that is known about the stock and its potential." This implies that by understanding price movements and charts, we have a window into the collective knowledge and sentiment of the market.
Another fundamental pillar of technical analysis is the use of japanese candlestick patterns. These patterns, made up of individual candlesticks on a chart, offer direct insights into market sentiment. They can visually depict who's in control, the bulls or the bears, and provide clues as to where the market might be heading next. Traders often rely on them because they can quickly convey complex market dynamics in an easily digestible form.
What are Candlestick Patterns?
Candlestick patterns are a charting and analysis technique with roots in Japan, where it has been utilized for centuries. The term "candlesticks" encompasses both the method of visually representing stock and futures data and the art of identifying specific combinations of these candlesticks in established configurations.
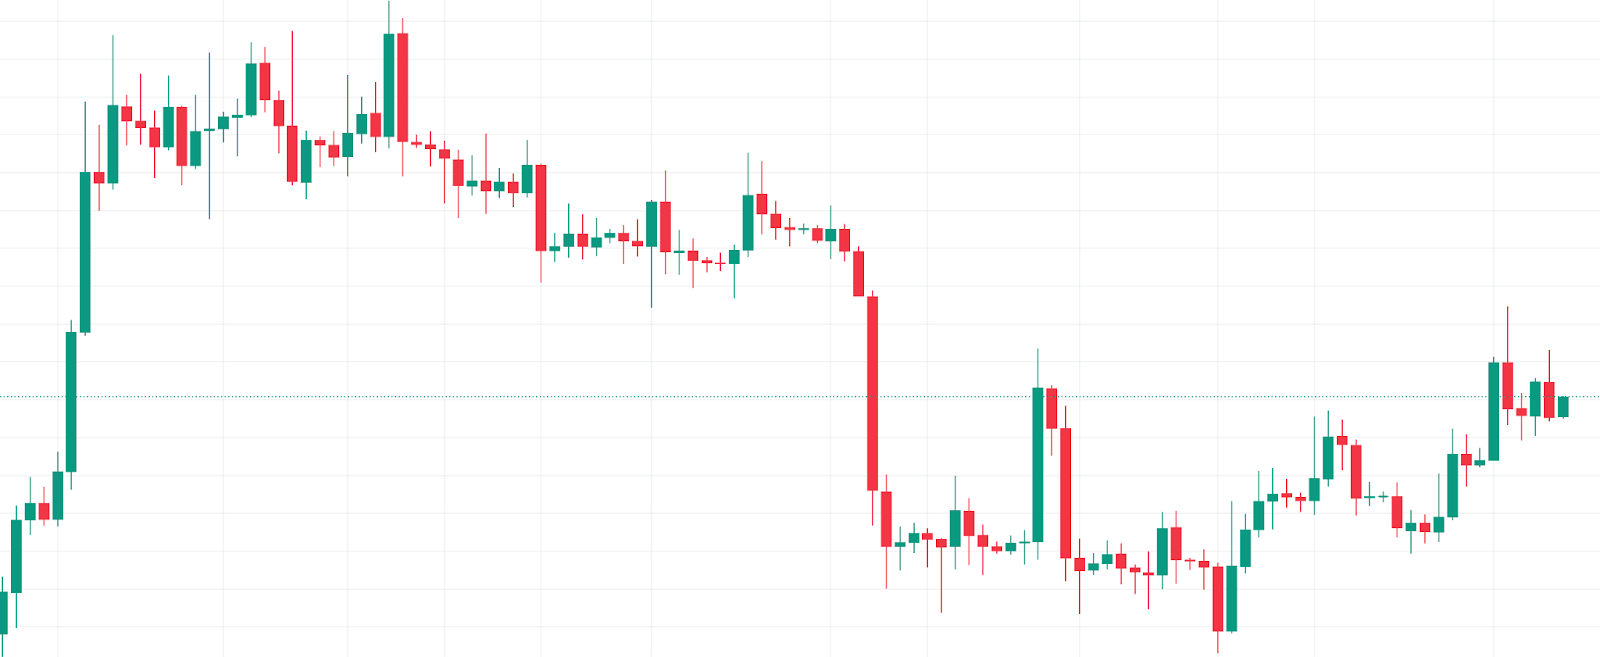
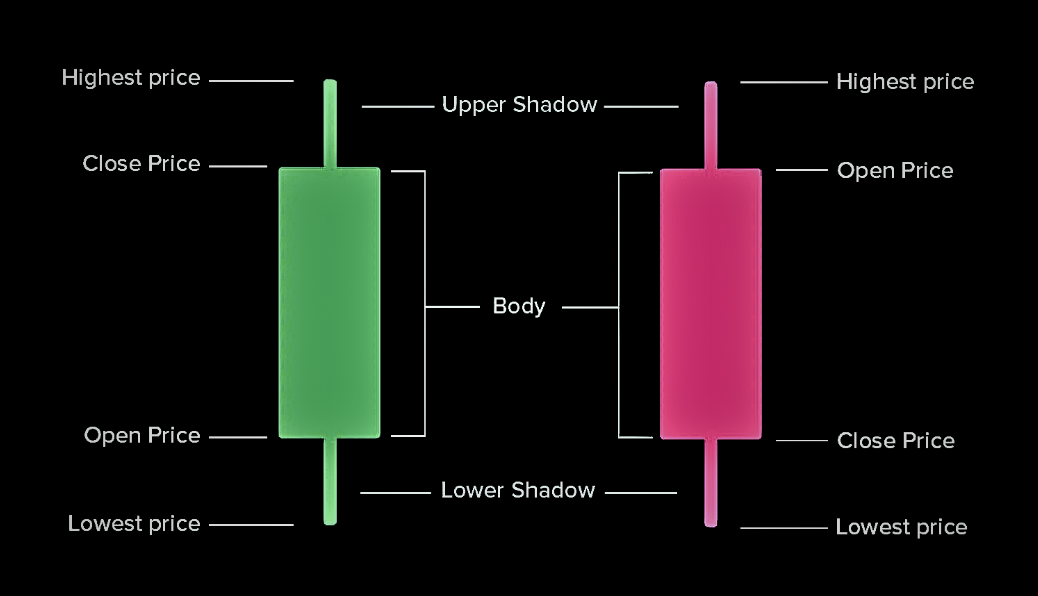
In essence, candlestick charting provides a visual representation of market data that uses open, high, low, and close prices, much like standard bar charts. However, candlestick charts are often deemed more visually intuitive. These charts resemble candles with wicks, with the rectangle—or "body"—showing the difference between the day's open and close prices.
“The different shapes for candlesticks have different meanings. The Japanese have defined different primary candlesticks, based upon the relationship of open, high, low, and close prices. Understanding these basic candlesticks is the beginning of candlestick analysis.” - John Murphy
Most Common Candlestick Patterns Used in Predicting Prices
Understanding candlestick patterns is crucial for trading. Let's explore three key patterns: one bullish, one bearish, and one that can swing either way. Our guide breaks it down into three main parts:
-
Nature: This tells you if the pattern suggests rising (bullish) or falling (bearish) prices.
-
Situation: Here, we describe what the pattern looks like and what it generally means for the market.
-
Considerations: This offers extra tips and things to keep in mind when you see the pattern, helping you make better decisions.
With this structure, you'll get a clear idea of how each pattern works and how to use it in your trading strategy.
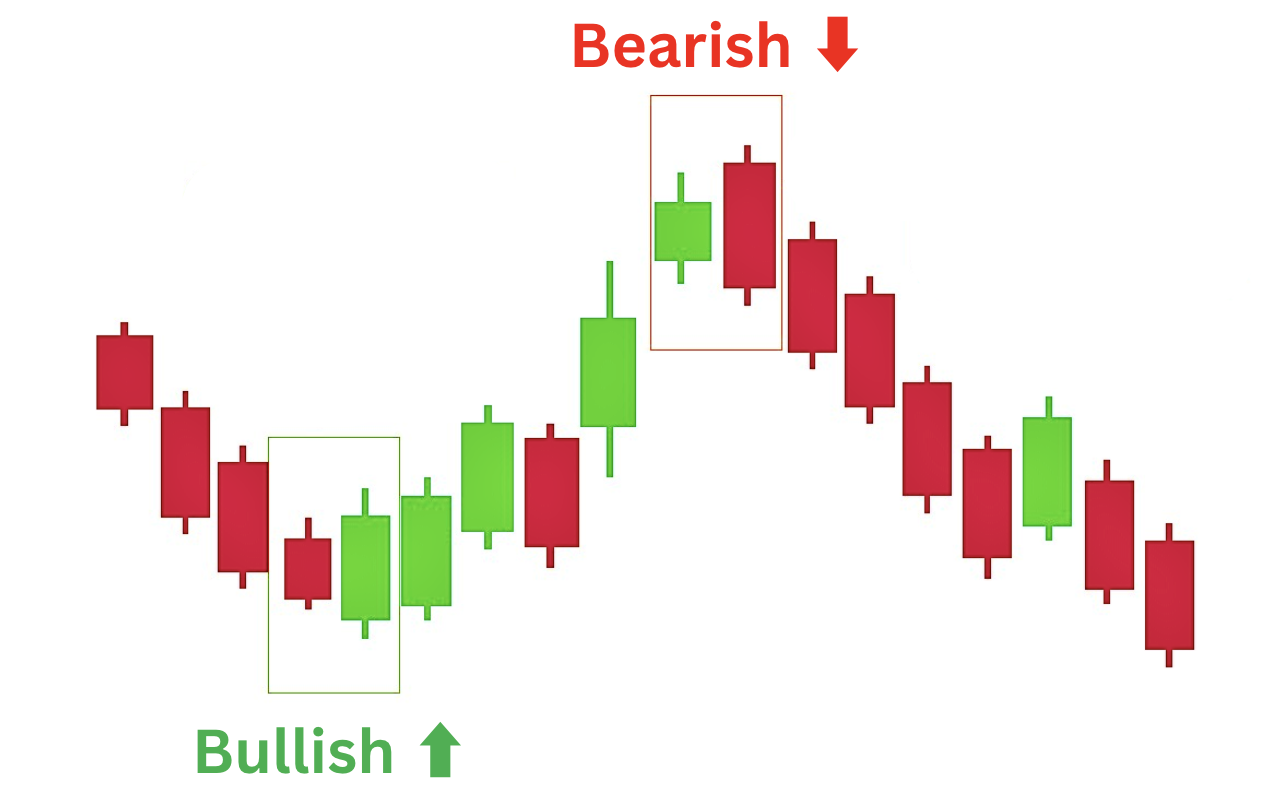
Engulfing Candlestick Pattern
Nature:
-
Can be either Bullish or Bearish.
Situation:
-
Bullish Engulfing: A small bearish candle is followed by a larger bullish candle, suggesting a bullish reversal.
-
Bearish Engulfing: A small bullish candle precedes a larger bearish one, indicating a bearish reversal.
Considerations:
-
The second candle's body must entirely engulf the first candle's body.
-
For bullish engulfing, traders generally seek buying opportunities.
-
For bearish engulfing, traders consider shorting opportunities.
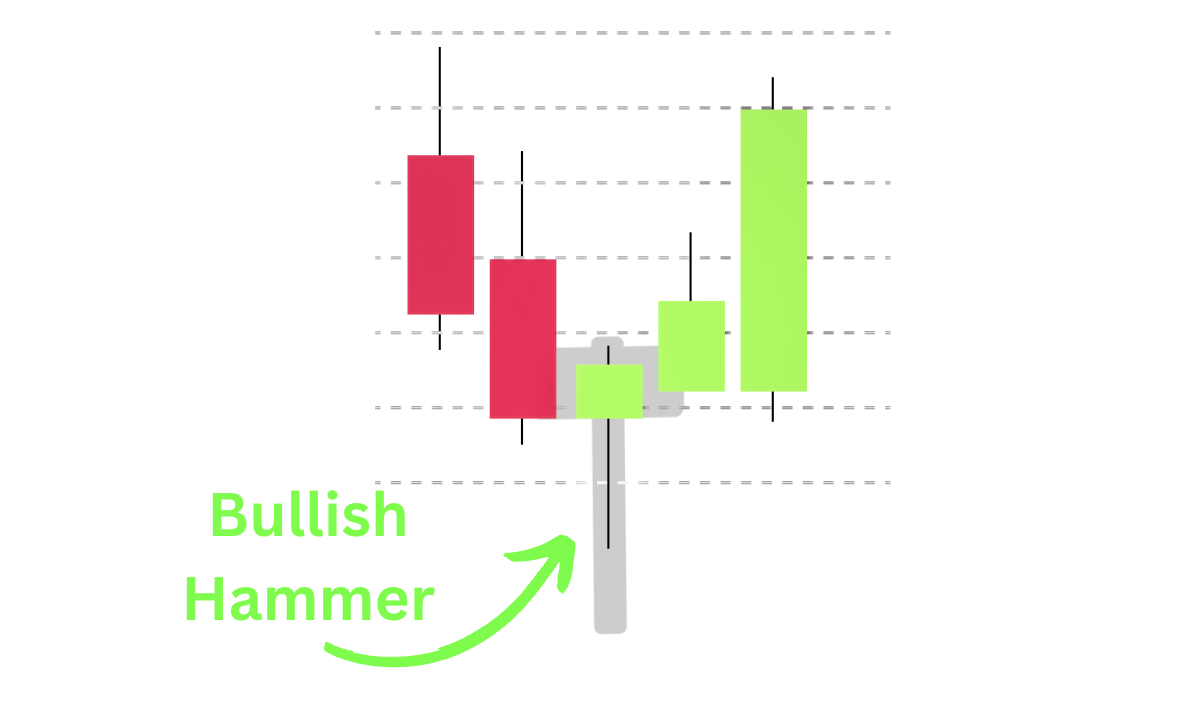
Hammer Candlestick Pattern
Nature:
-
Bullish
Situation:
-
Forms primarily in a longer-standing downtrend and signals a potential trend reversal.
Considerations:
-
Recognizable by a small body near the top and a long lower wick.
-
The long lower wick indicates that sellers initially drove prices down, but buyers countered, pushing it back up.
-
Represents strong support and indicates that buyers are gaining strength.
-
Most accurate when spotting the end of a downtrend.
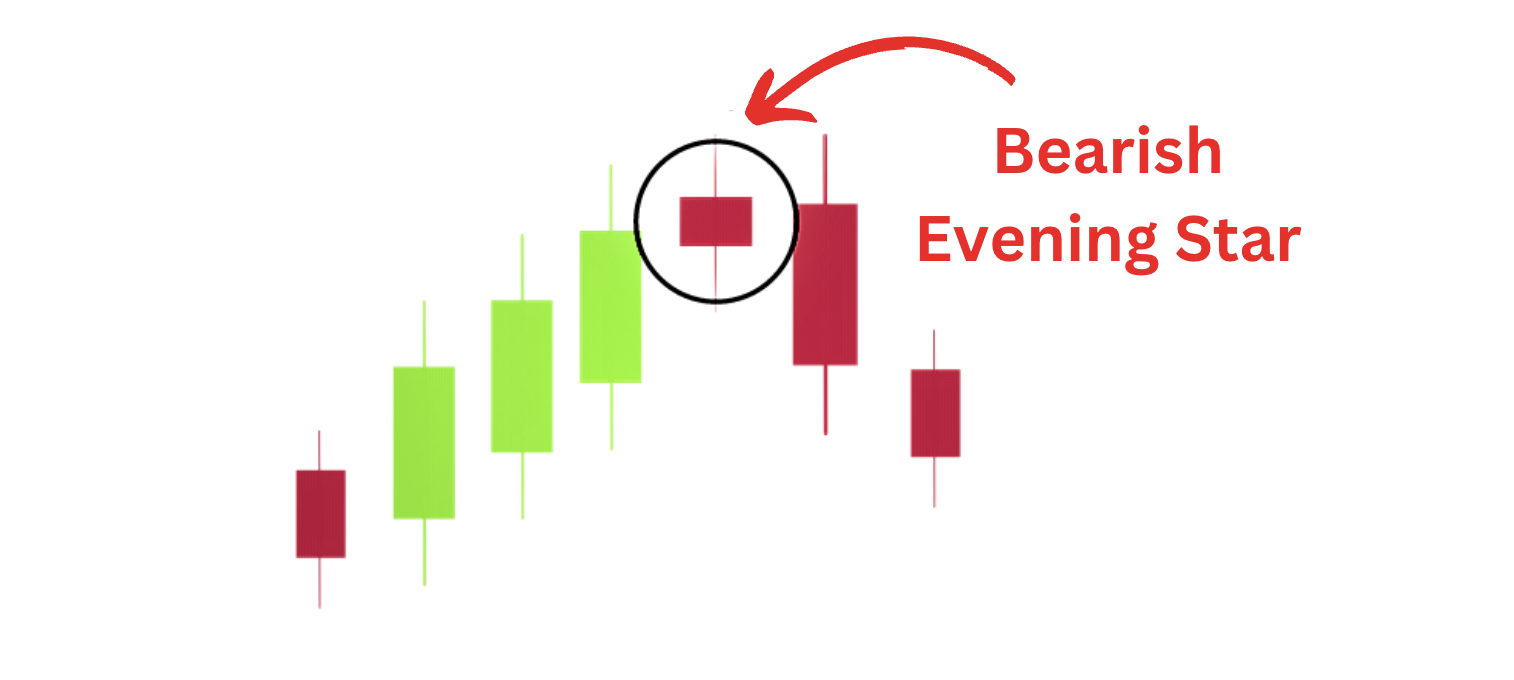
Evening Star Candlestick Pattern
Nature:
-
Bearish
Situation:
-
Most reliable after a prolonged uptrend, signaling a possible shift from bullish to bearish sentiment.
Considerations:
-
Consists of three candles: A bullish candle. A small candle (bullish or bearish) near the closing price of the first candle. A large bearish candle, with a body equal to or greater than the first candle.
-
Represents diminishing buying pressure and potential rise in selling pressure.
-
Viewed by traders as a strong sell signal.
Tips for Trading Candlestick Patterns
Candlestick patterns are valuable tools for predicting market prices with a high degree of accuracy, but they are not the holy grail of trading. The reliability of these patterns depends upon various factors, including the timeframe under consideration, the specific market being analyzed, and the overall market context.
To mitigate the risk of false signals and market noise, it is advisable to supplement candlestick patterns with additional technical analysis tools. Combining them with trend lines, support and resistance levels, as well as other technical indicators, can yield more reliable results.
Conclusion
Drawing from the wisdom of John J. Murphy, we've highlighted that the market's price often reflects all available information. One of the main tools we focused on is candlestick patterns, which come from Japan and help show us how prices might move. These patterns tell us if the market feels positive, negative, or unsure. By understanding the different shapes and meanings of these patterns, traders can make better decisions about buying or selling.
In our article, we looked at various patterns, from those showing rising prices to those hinting at a drop. But it's essential to remember that these patterns are just one part of the puzzle. To make the best trading choices, it's always a good idea to use other technical analysis tools and even combine it with fundamental analysis. Now, with this knowledge, you're hopefully better prepared to make predictions in the crypto market.


